


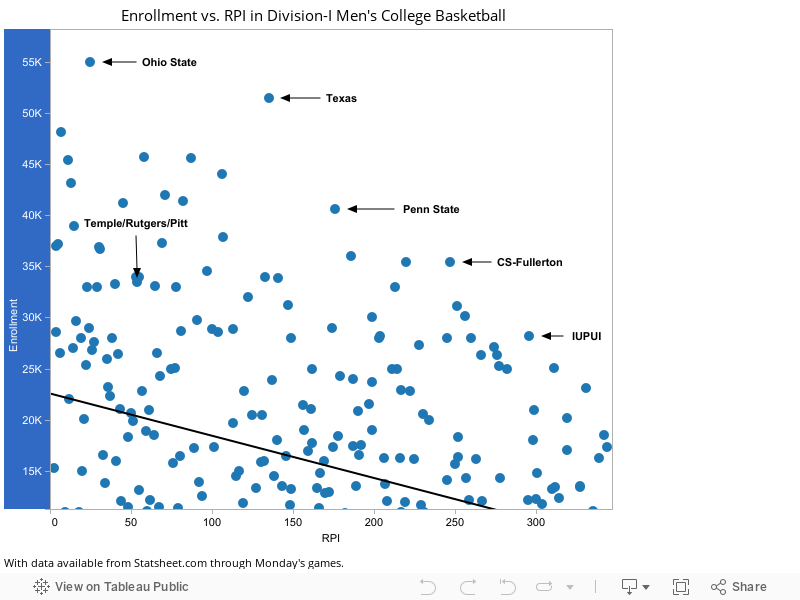
Note: The above chart is interactive. Hover or click on any mark for school name, conference, enrollment, RPI, offensive efficiency and total wins. There's a larger version available at this link.
Datasets are what initially attracted me to college basketball. It sounds strange, and my girlfriend definitely doesn't understand, but for me the beauty of college basketball is in the numbers. There's just an endless amount of combinations, sorts, filters and functions, and 347 teams, 33 conferences and 1,799 players to apply them to.
Last night it was Statsheet.com's advanced team search function that had me holed up for hours. Using this tool you can find any number of quirky lists, but I couldn't pull myself away from the enrollment data.
I was curious to see if I could get a better handle on the correlation between school size and basketball performance. I had no doubt that such a correlation existed, it's just an extraodinary experience to actually collect the data, chart it and discover tenable proof.
Now, normally I prefer to measure team efficiency using tempo-free data, but Statsheet's advanced search function doesn't include Ken Pomeroy rankings, so the much-maligned RPI it was. I also would have preferred more historical data for a stronger and larger dataset, but only data from the 2012-2013 season is available.
The final list I arrived at mysteriously included 334 teams. I don't know which 17 are missing, but I do know that CS-Bakersfield and Nebraska-Omaha are two of them (if you somehow find another one let me know).
Duke, Gonzaga, Butler and Belmont form a core of schools with under around 6,500 students and an RPI ranking that is 17 or better. These are the "impressives" of the resulting chart, which is above. You can also click here to play around with it more. It's an interesting look at how teams stack up without the labels of high-, mid- and low-major and without conference lines.
On the other end of the spectrum are teams like Texas (51,438 students, RPI 135), Penn State (40,571, 176) and Cal State Fullerton (35,413, 247) that underperform given their high levels of enrollment.
The function of the trend line (Enrollment = -41.3348*RPI + 22557.8) means that teams like Louisville (22,000 students, RPI 12), Memphis (20,668, 50), Wright State (16,488, 146) and Maryland-Baltimore County (9,668, 317) are the epitome of average.